My short post a few weeks ago on one of Schumpeter’s ideas lightly suggested you could derive most of modern business strategy from that one idea. I suppose this might technically be true if you are a genius with a lot of extra time, but why reinvent the wheel?
Last week I taught my class at Columbia’s engineering school about industry analysis. I used the Schumpeter idea as the starting point for why entrepreneurs need to analyze the industry they want to enter but then quickly segued into Michael Porter’s work on business strategy for the rest of the why and much of the how. One of the readings was Porter’s classic article “The Five Competitive Forces That Shape Strategy” and you should read that before this. (You can see the rest of the syllabus here.)
Porter is business strategy from 30,000 feet. His tools give a great overview, but because they are so general they can be hard to apply to specific situations. Regardless, if applied with rigor–meaning with actual data and analysis, not anecdote and belief–you can glean a ton of insight reasonably quickly.
Below are the slides from the class. They are meant to:
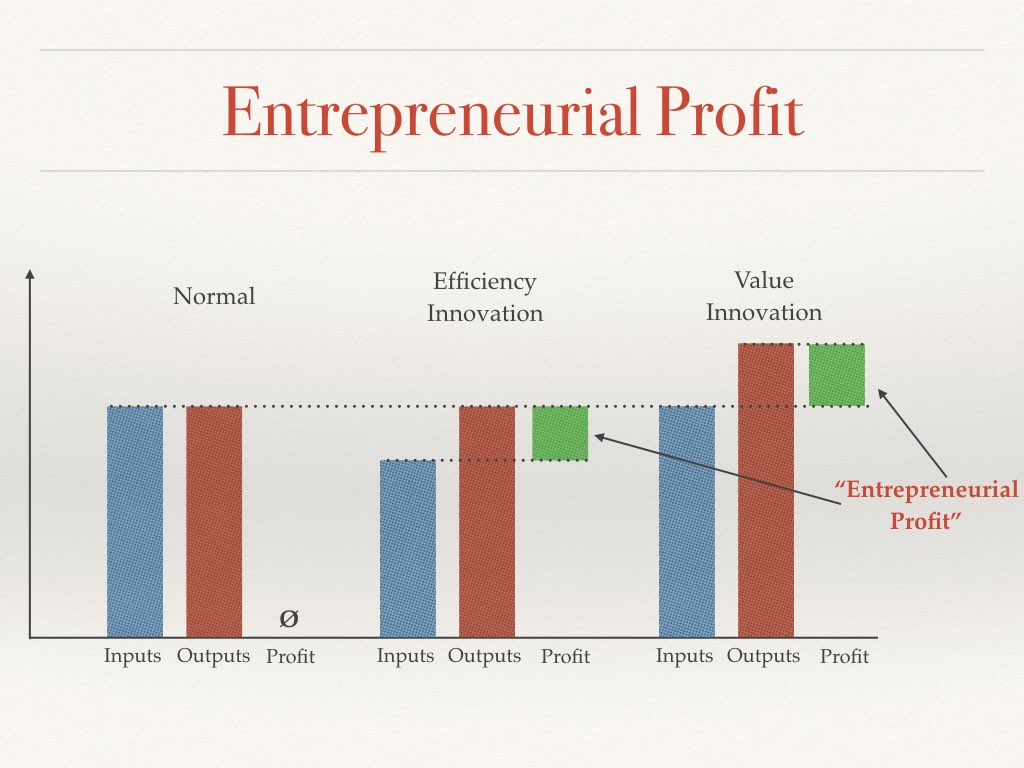
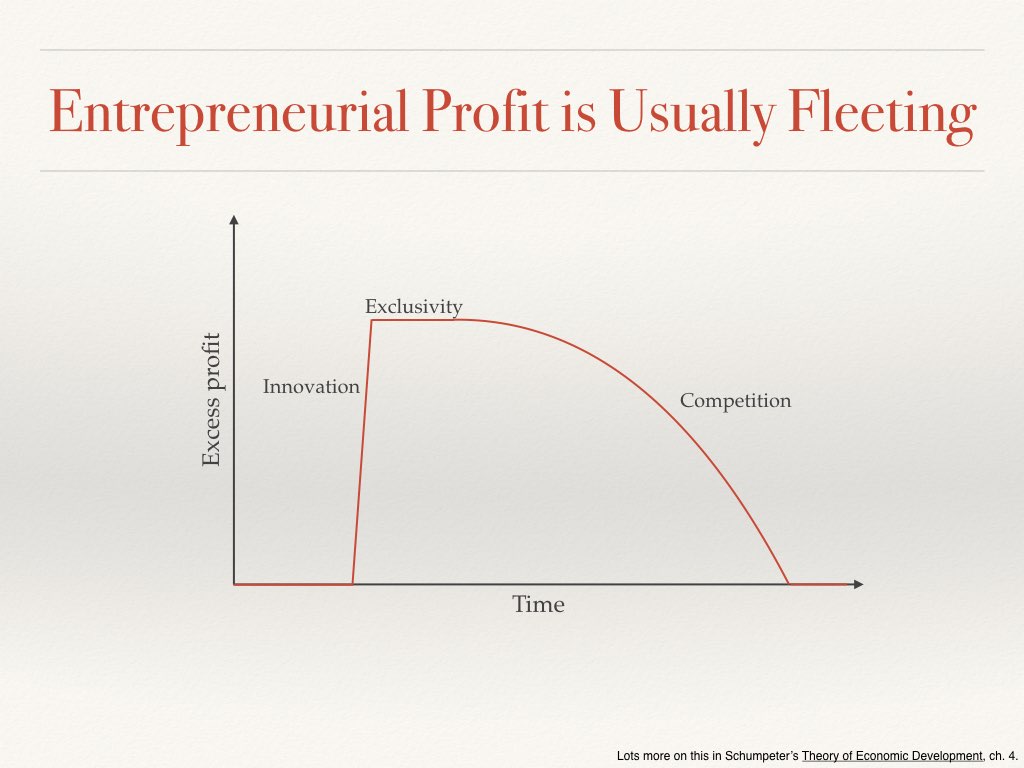
- Introduce the idea of innovation as the source of excess profit;
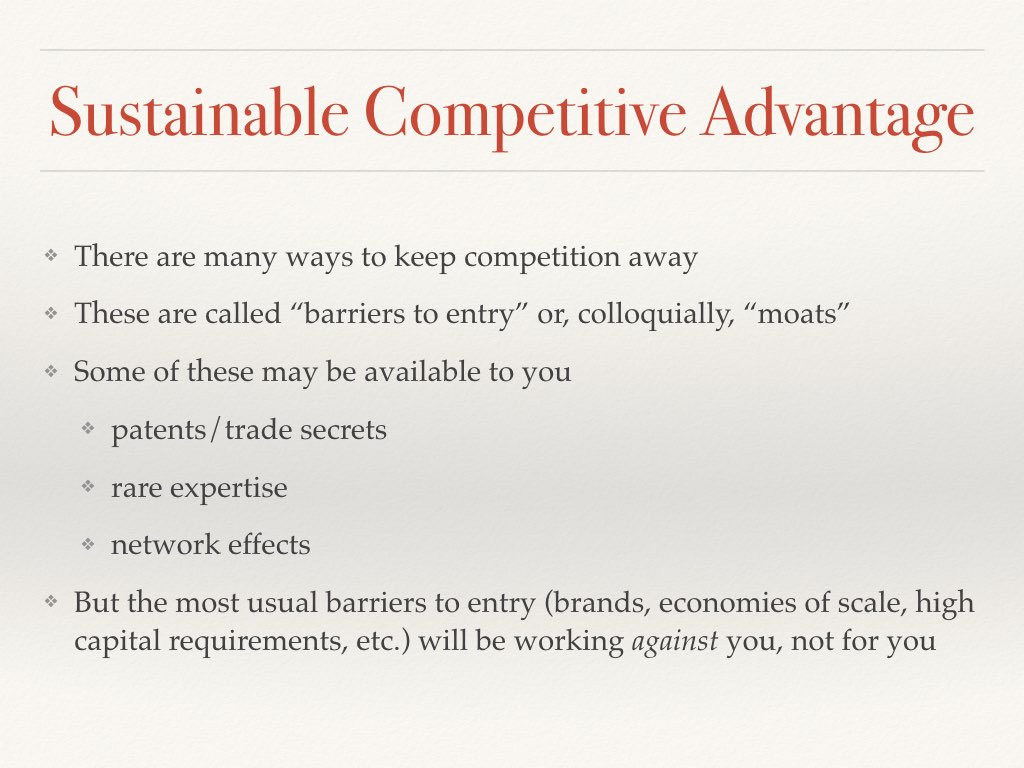
- Show that innovation alone is not always a sustainable competitive advantage (“SCA”);
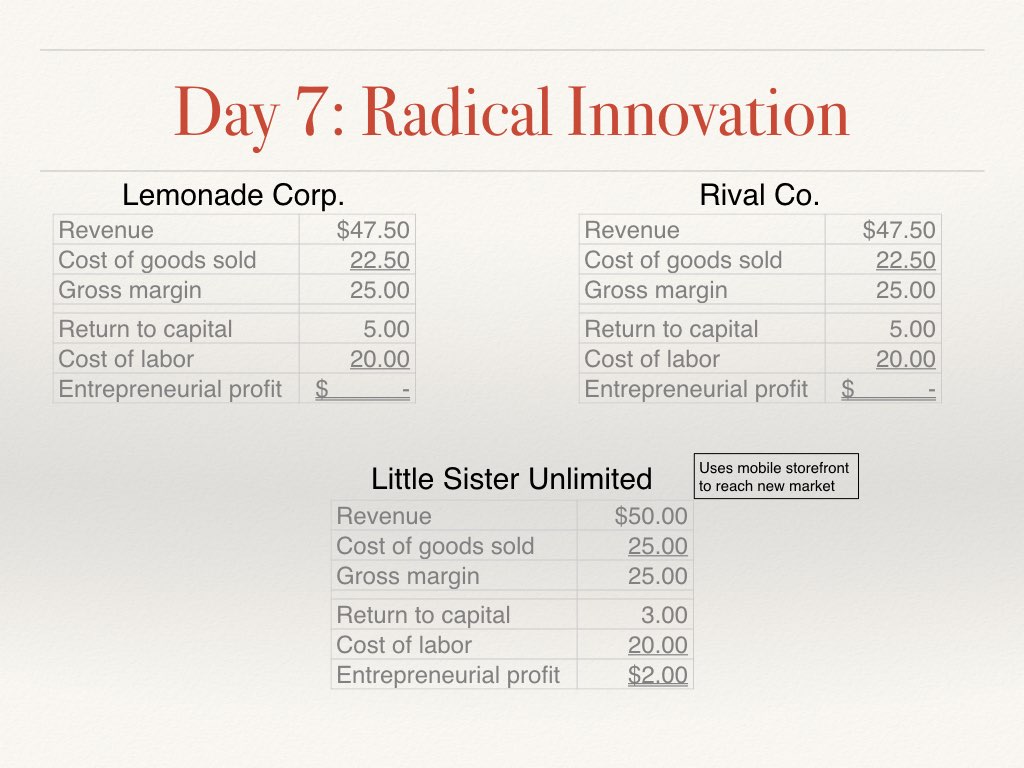
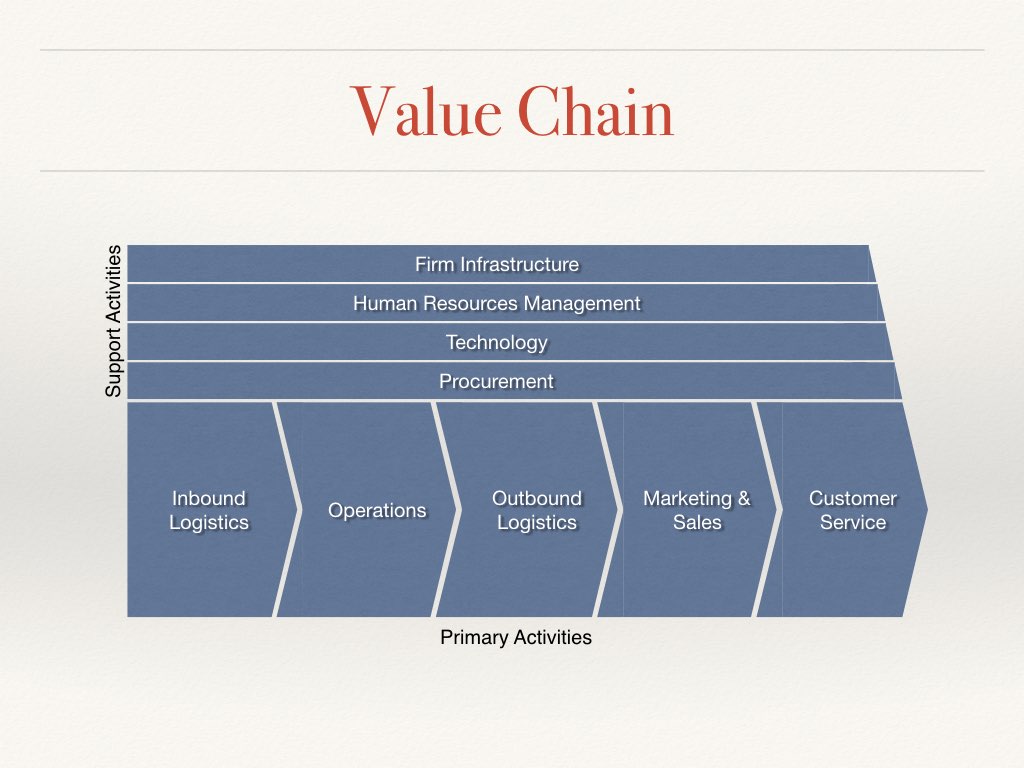
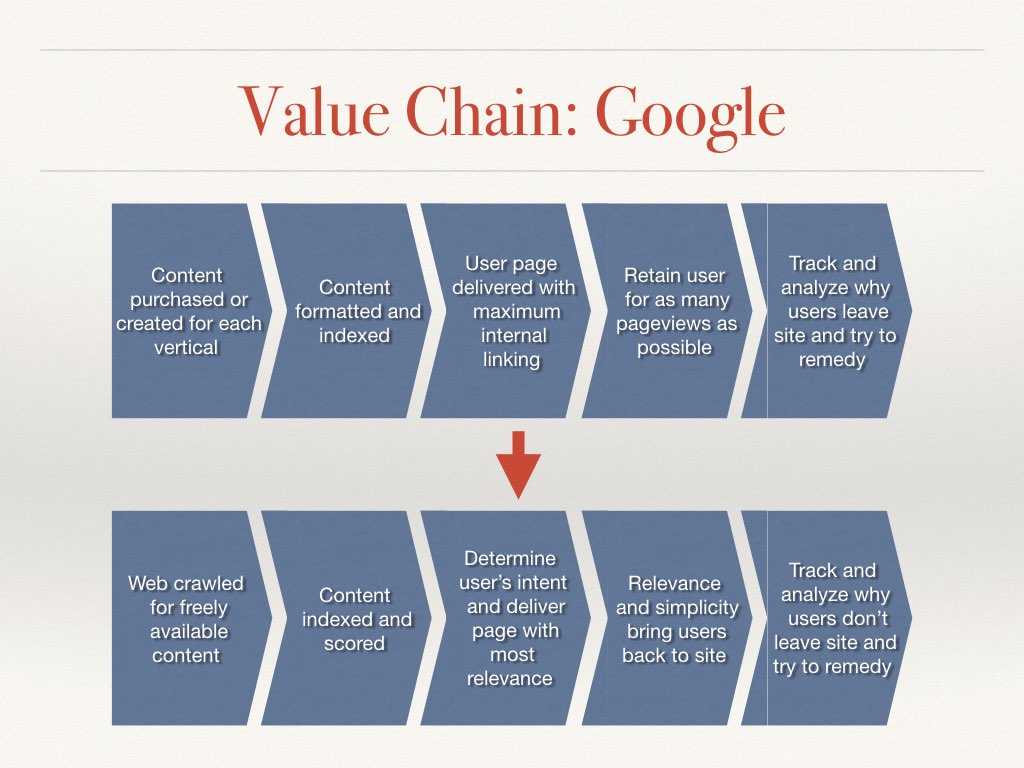
- Talk about how new value propositions supported by changes in value chains can create SCAs;
- Convince my students that to be able to find new value propositions and tell if the value chain to produce them is sufficiently differentiated so as to allow a SCA they must do some extensive industry research;
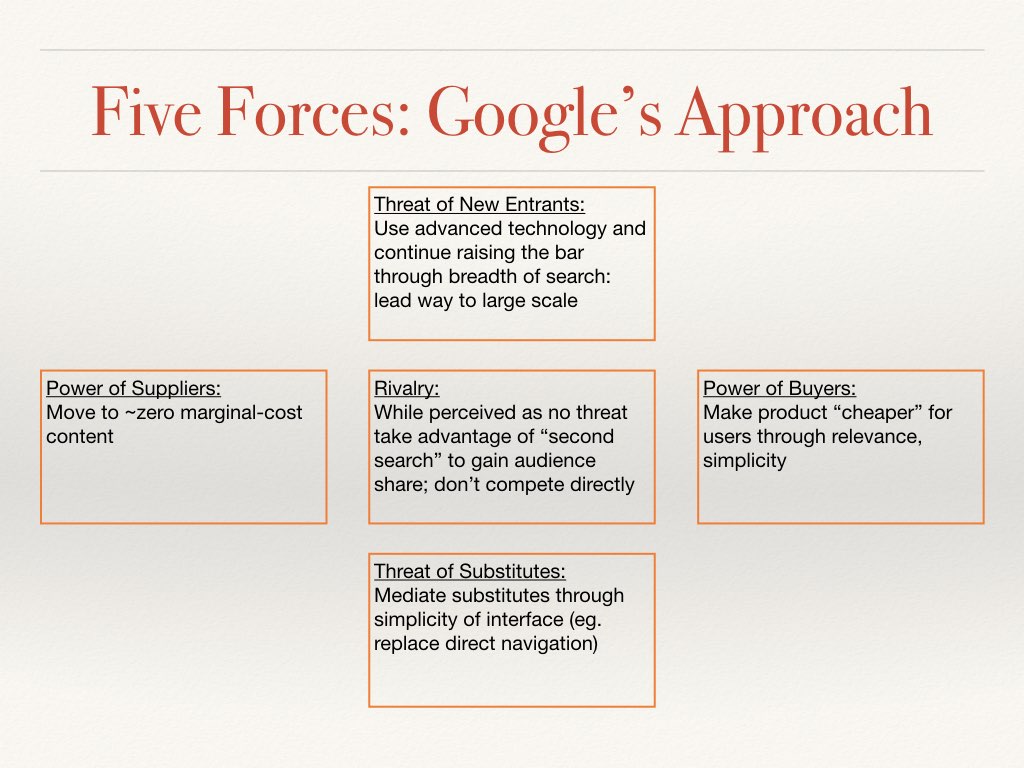
- Talk in more depth about Porter’s Five Forces as one of the tools to guide industry research.
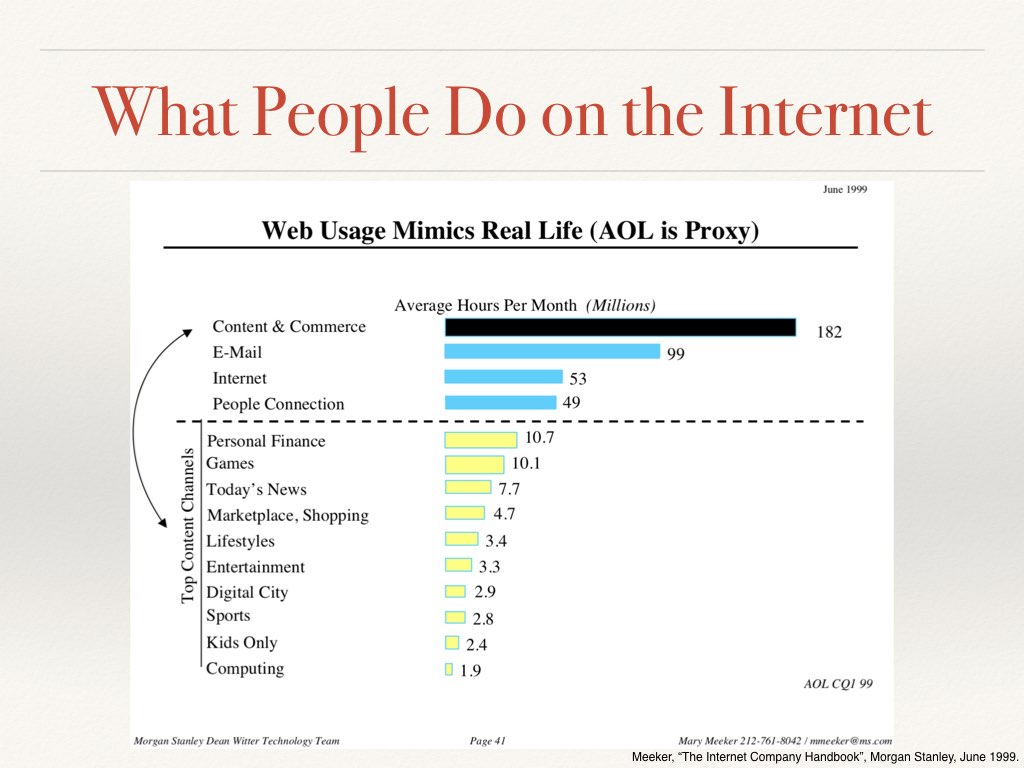
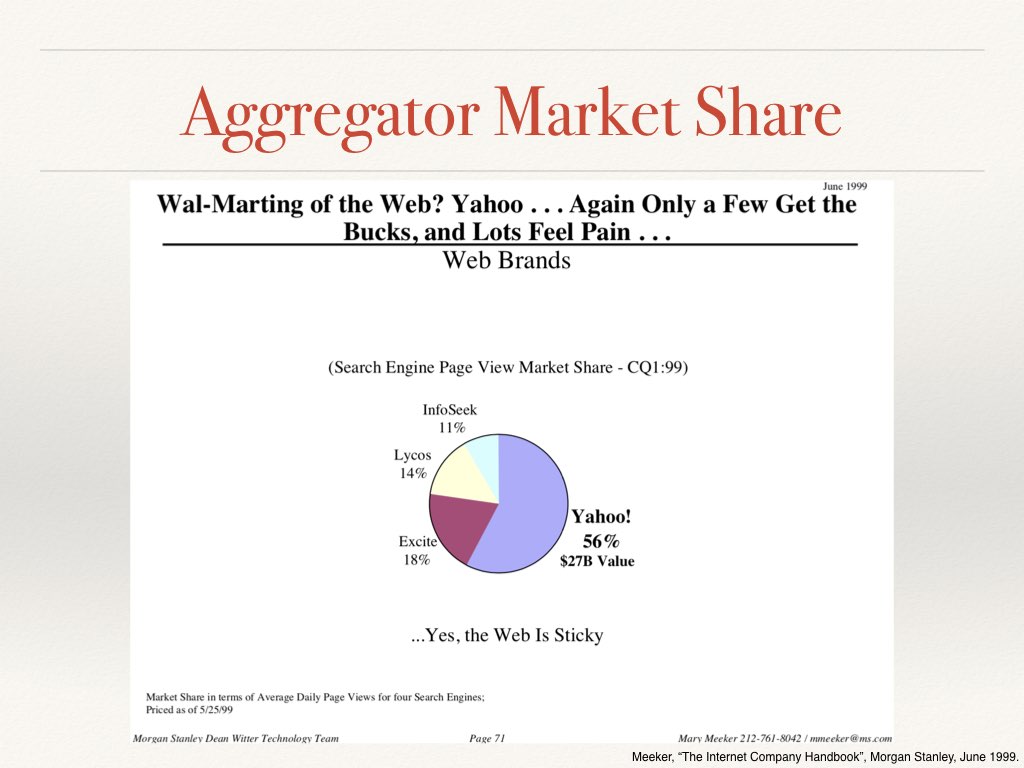
Much of the material here is from Joan Magretta’s excellent overview of Porter’s work, Understanding Michael Porter. The class had read a case study I wrote about Google’s entry into the search engine market, so I used Yahoo! as the exemplar of the market prior to Google and Google’s new value proposition and value chain as examples. I’ve interspersed a few sentences explaining what I was going on about, but I hope otherwise it’s self-explanatory.
nb: One student objected that this analysis neglects the not-for-profit sector. It does. Porter’s methods can be applied to non-profits, but I’m not knowledgeable enough to do so.
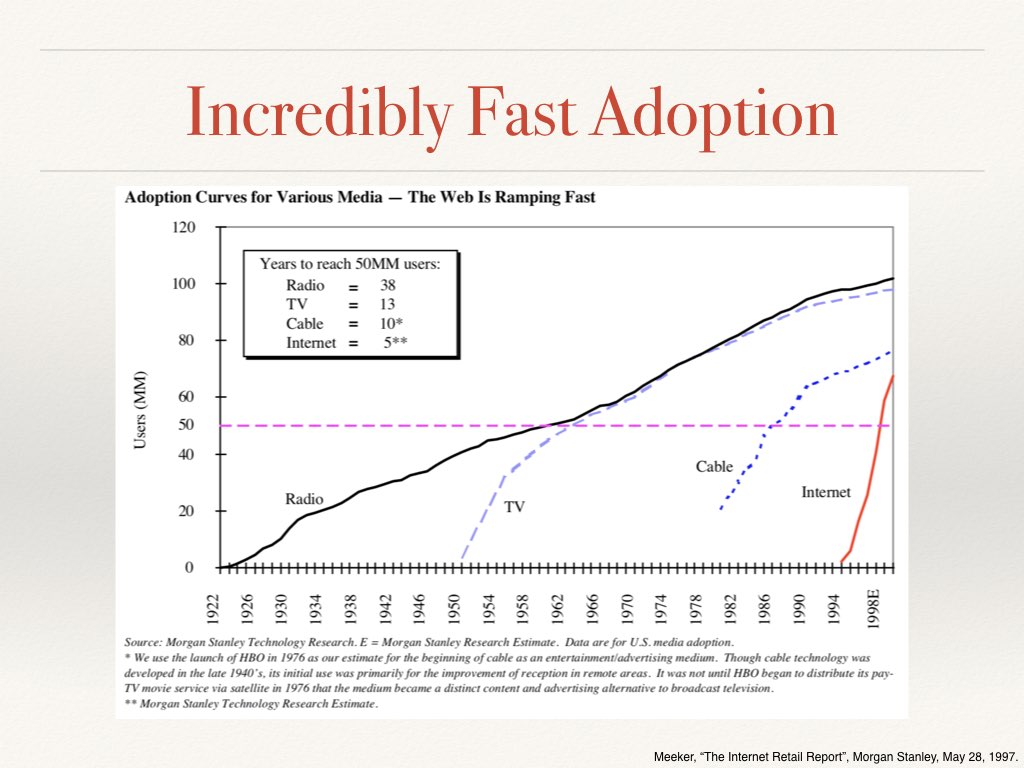
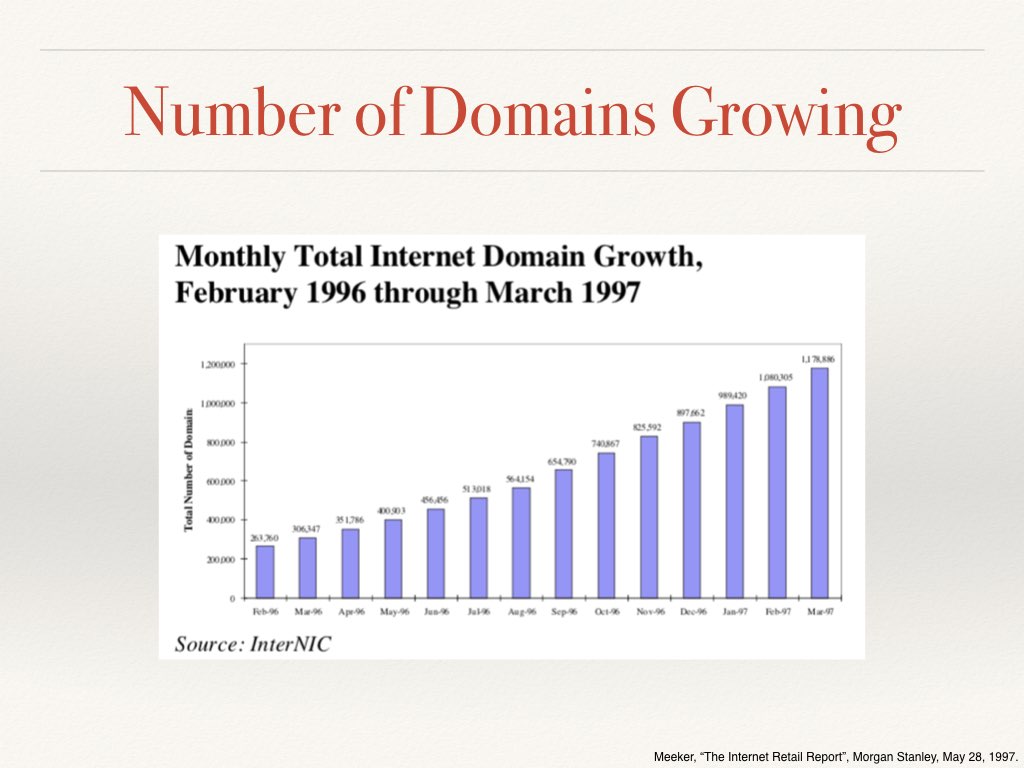
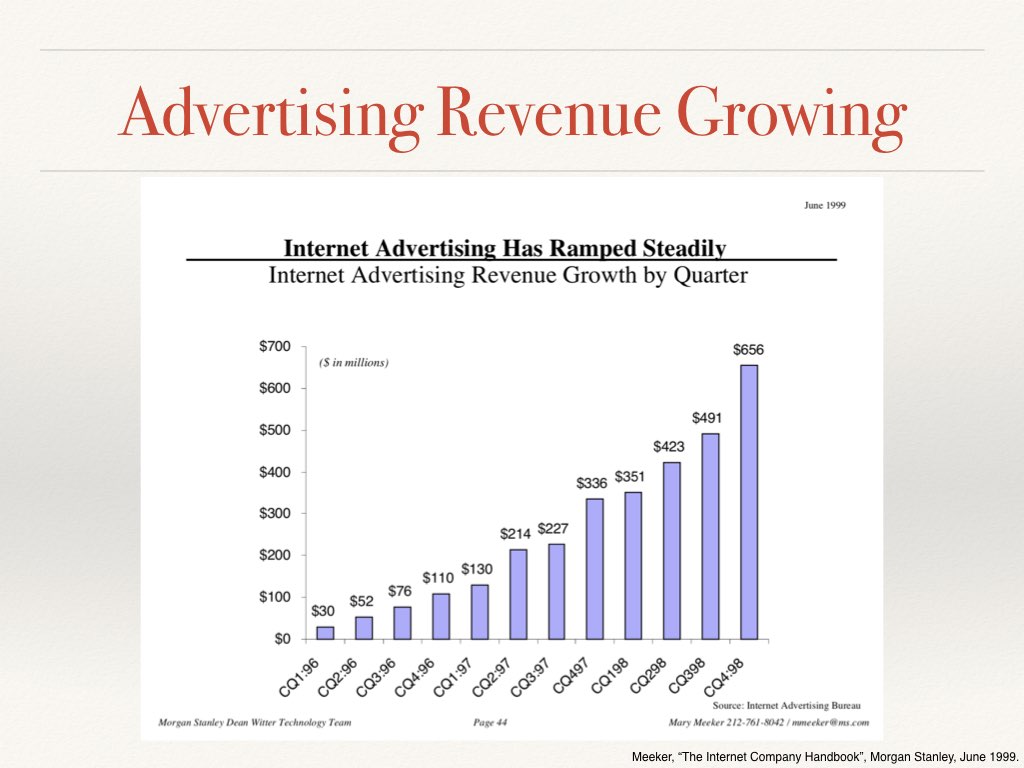
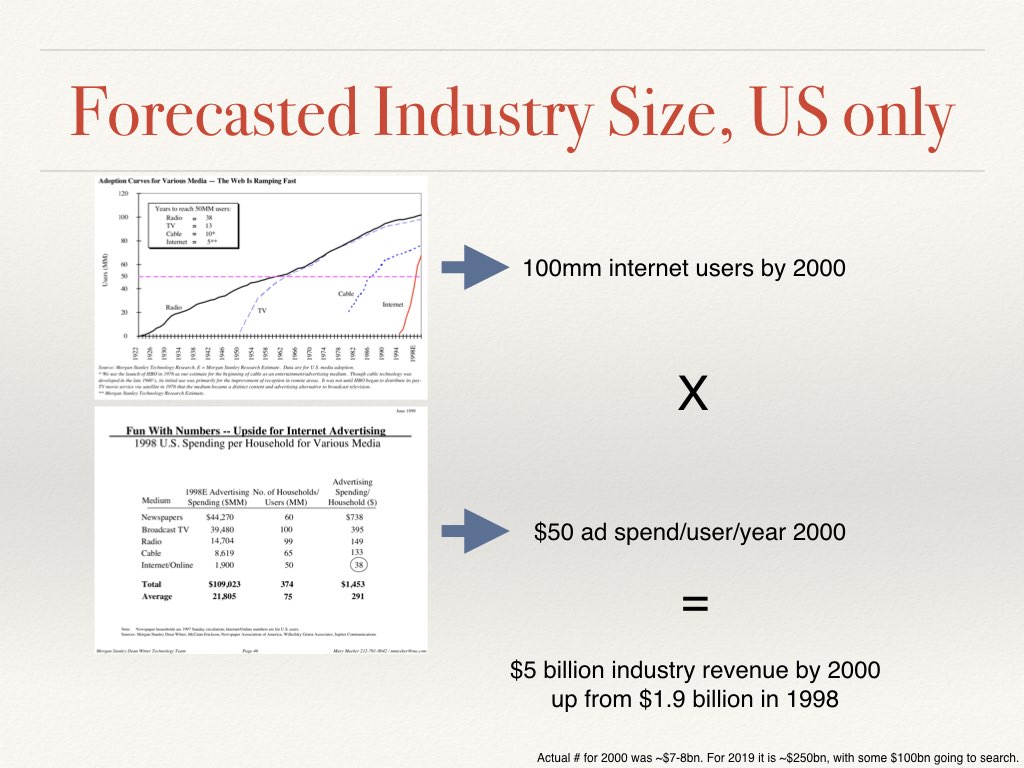
Thank you to Benedict Evans and Justin Wohlstadter, who helped me find Mary Meeker’s late-’90s Internet Reports.


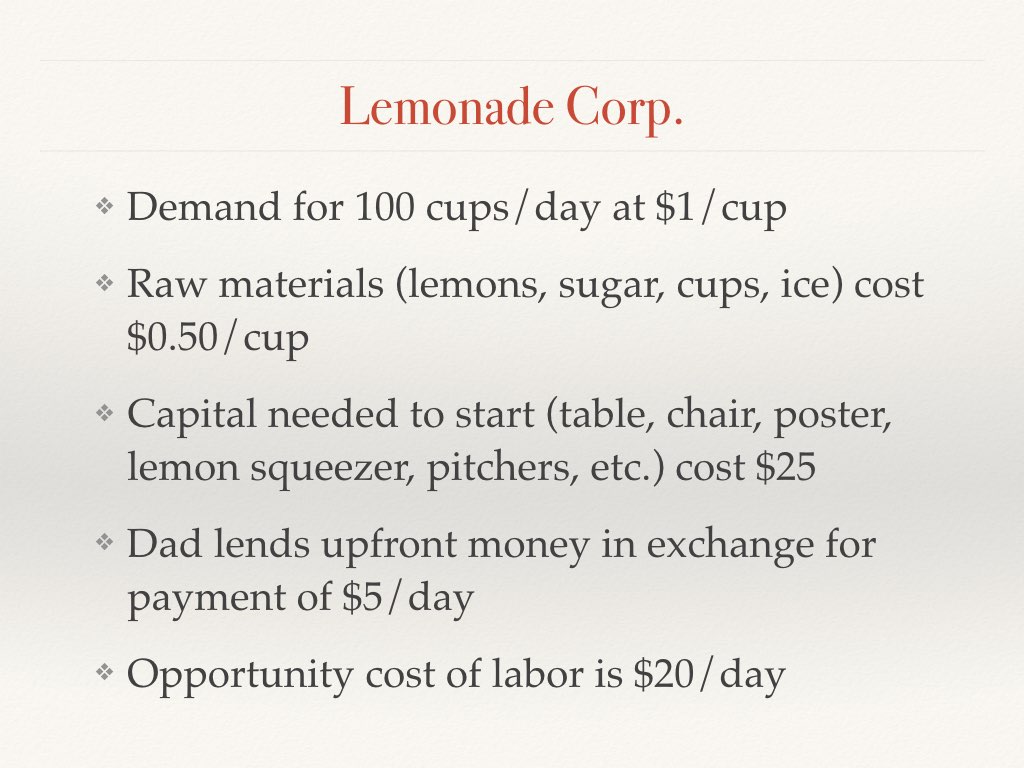
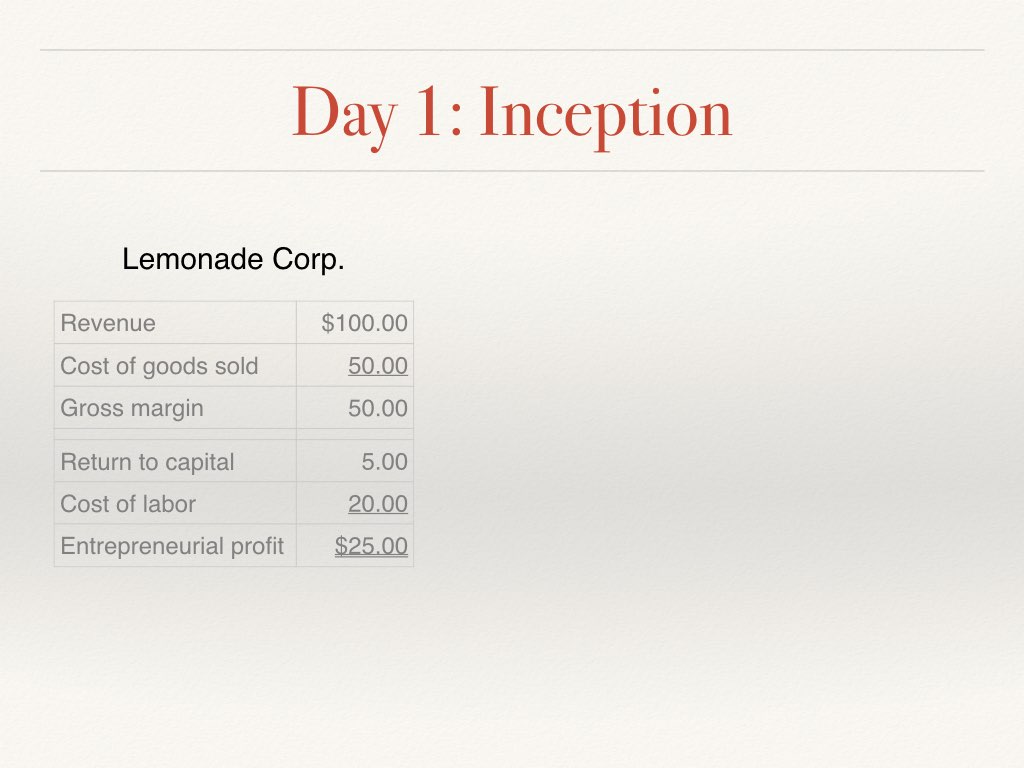
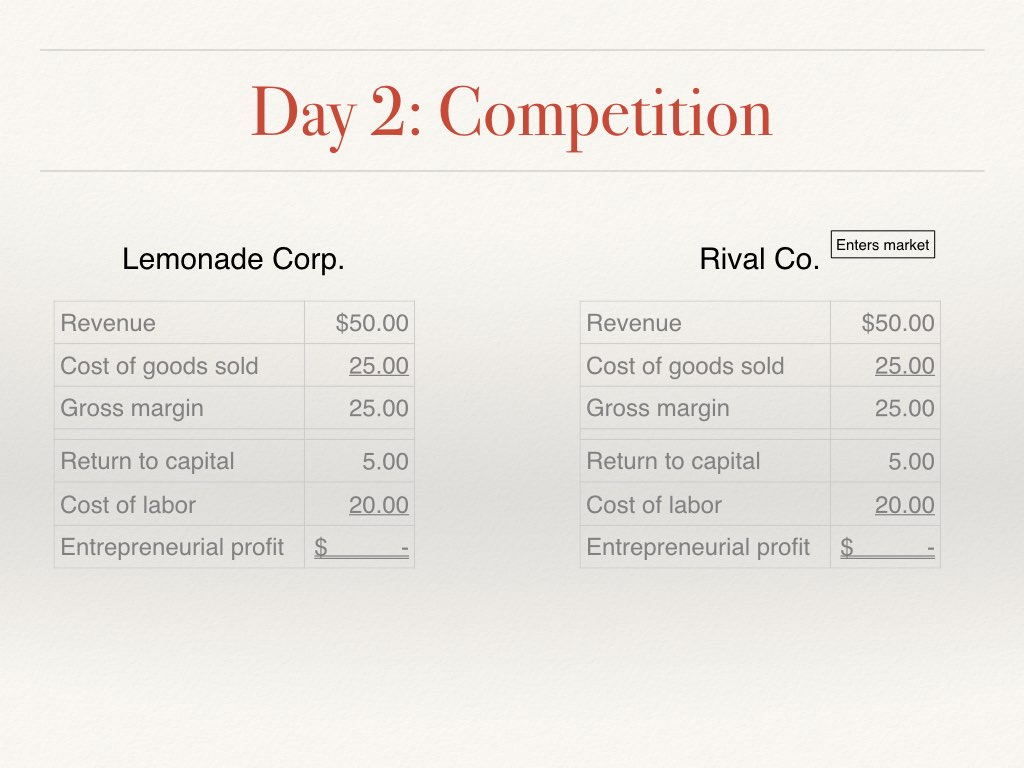
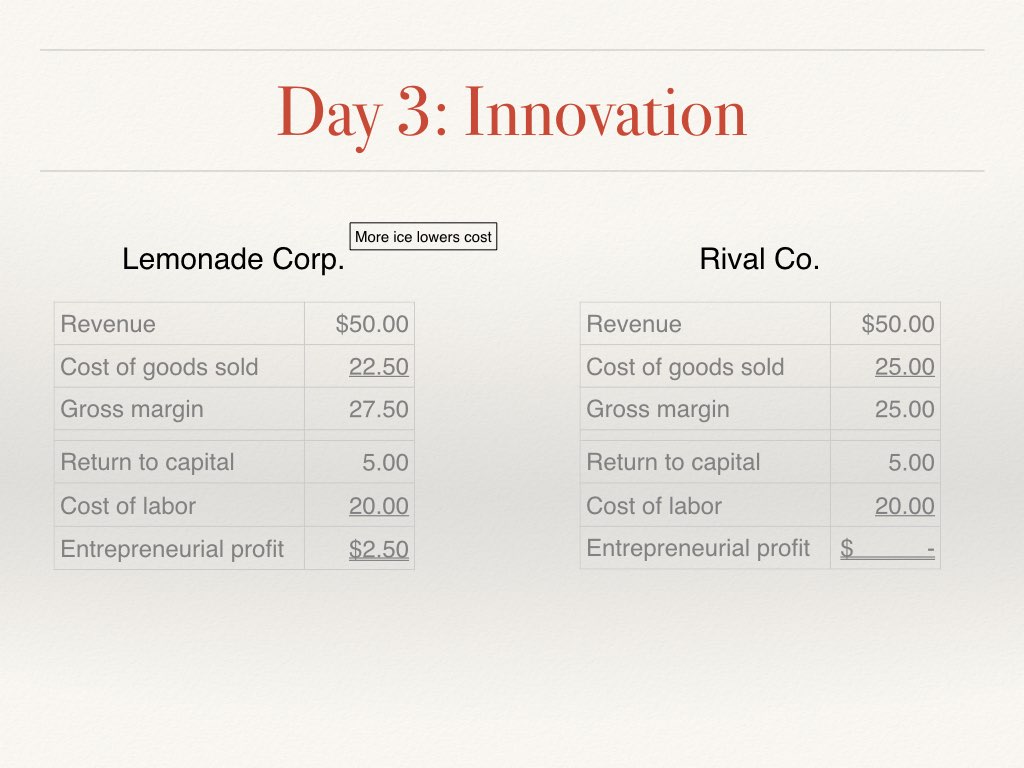
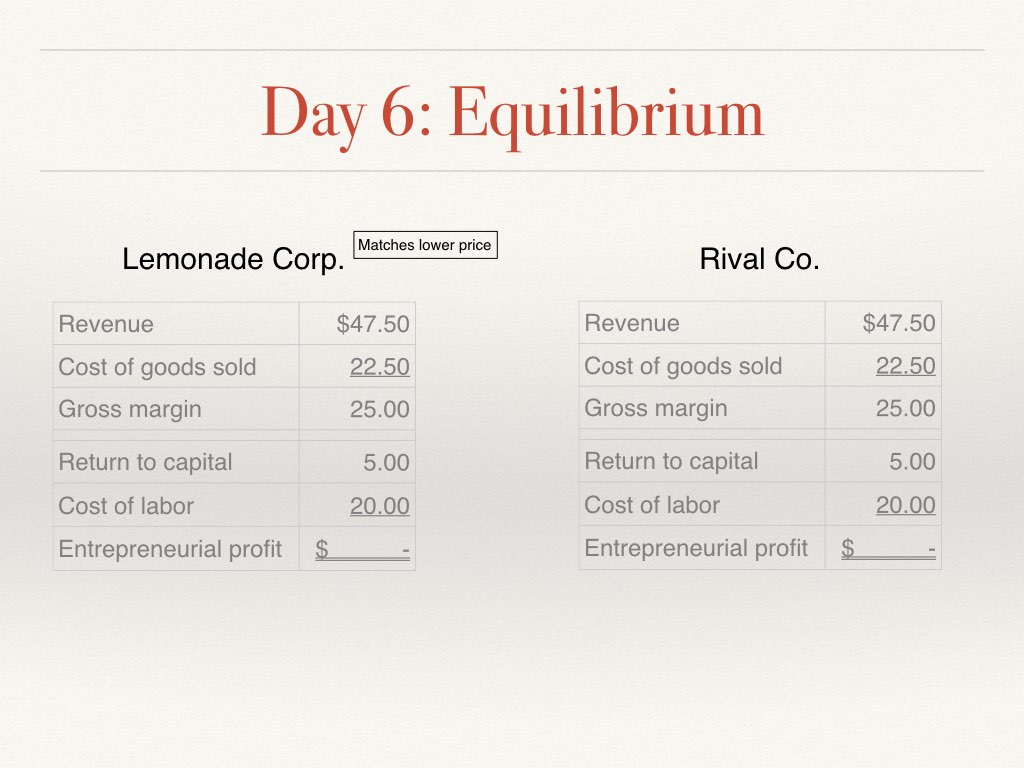
I know this example is toy, but it presents the issues of competition and innovation pretty starkly. It actually worked pretty well.
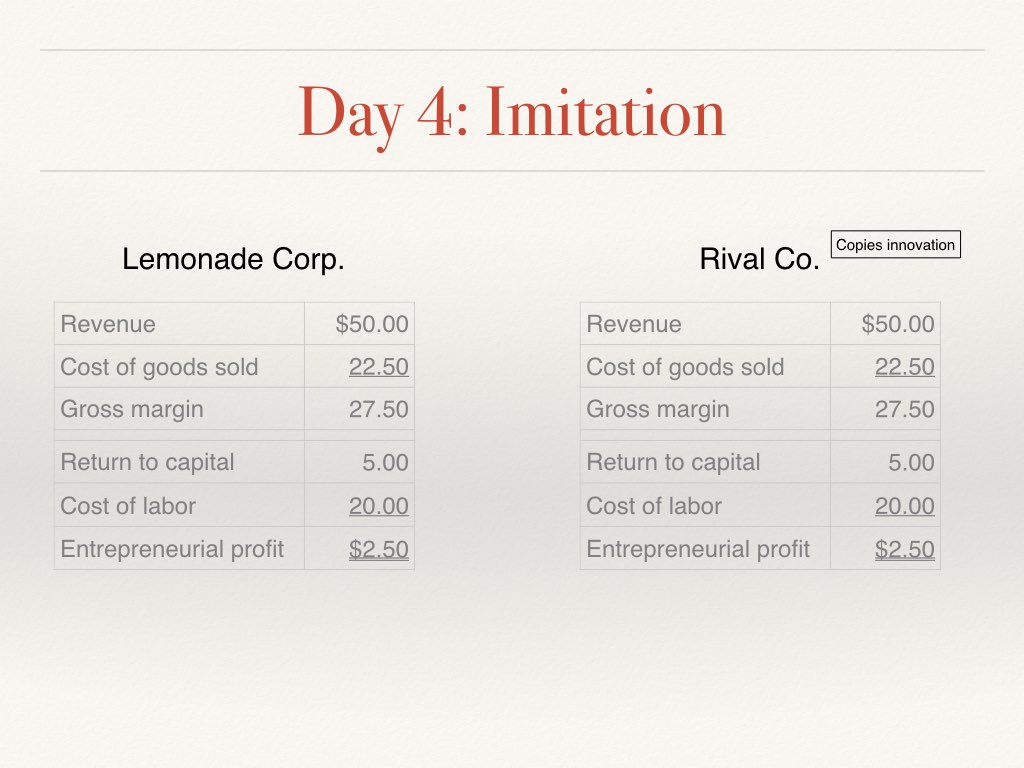


This below I talk about in the Schumpeter post if you want more explanation.
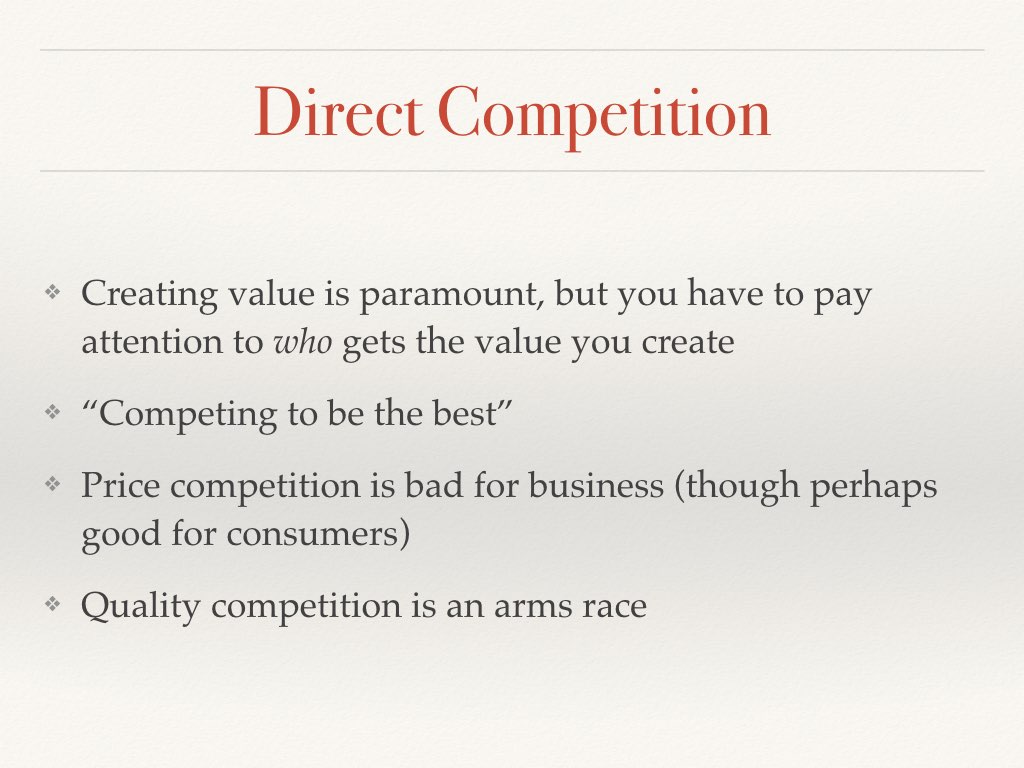
“Competing to be the best” is Porter’s way of talking about competition that involves no or easily copied innovation. All of the value created this way is garnered by their customers. This is good for the customers of course, but means that there is no return to the business on the time and money invested in this value creation. This is one of those places where I don’t know how to apply Porter’s ideas to not-for-profit enterprises.

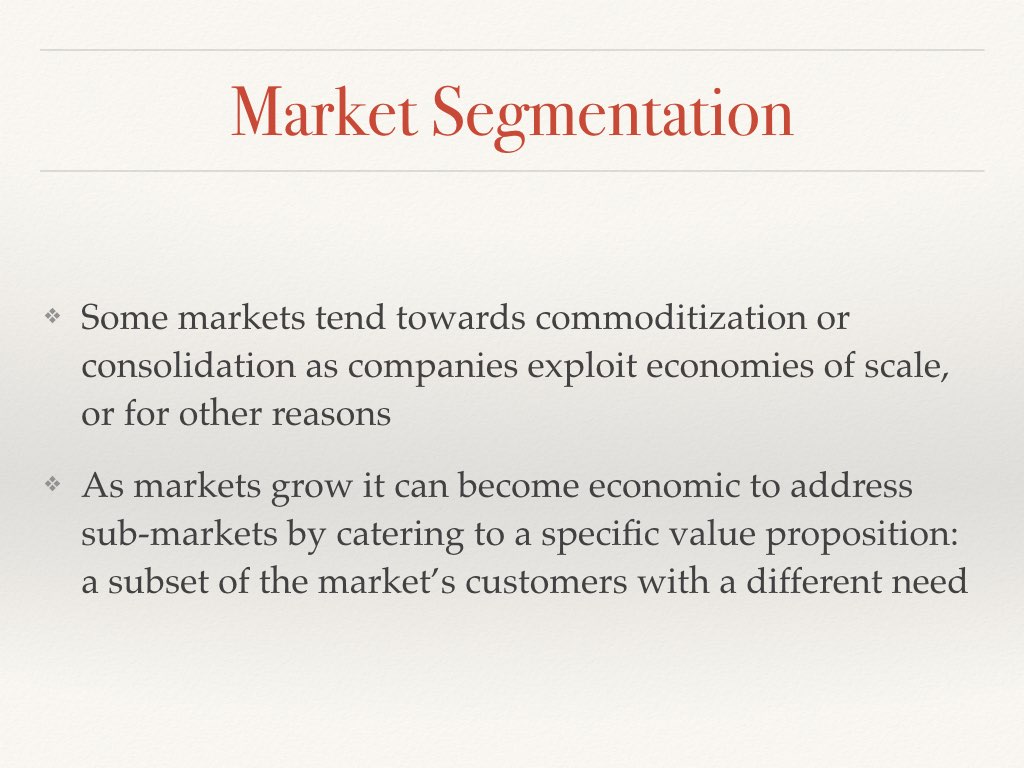
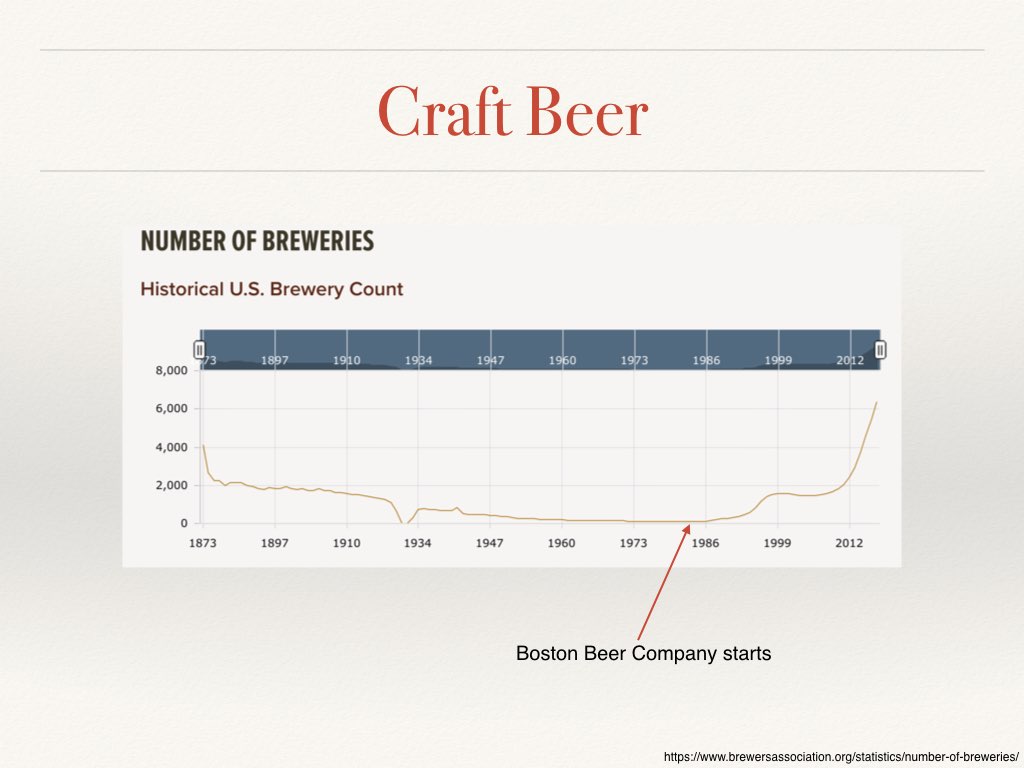
One way to avoid competing to be the best is to segment the market, and we talk about that a bit. It is less interesting to me than creating an entirely new market, but it’s probably more common. In the second slide we talk about the Boston Beer Company (maker of Sam Adams) segmenting the beer market and in the third we use Andrew Parker’s classic slide to show how focused competitors picked off pieces of Craigslist as those markets grew big enough to be standalone.


I can’t imagine this diagram is actually as universal as business strategy classes would have you believe. Nevertheless, it’s a good starting point.


You don’t really start your analysis with the five forces, you should first gather the data. I did it first in these slides because I always run over time and I needed to make sure we talked about this and value chains in this class.

By “covering framework” I mean that the framework covers all the issues and that it’s not worth arguing about the fine points of which thing goes in which box. This comes into play later when I put the users of Google (ie. the searchers) in the “Buyers” box, even though they are technically more like suppliers than buyers.
The next five slides are direct from Magretta, an invaluable reference on the five forces.
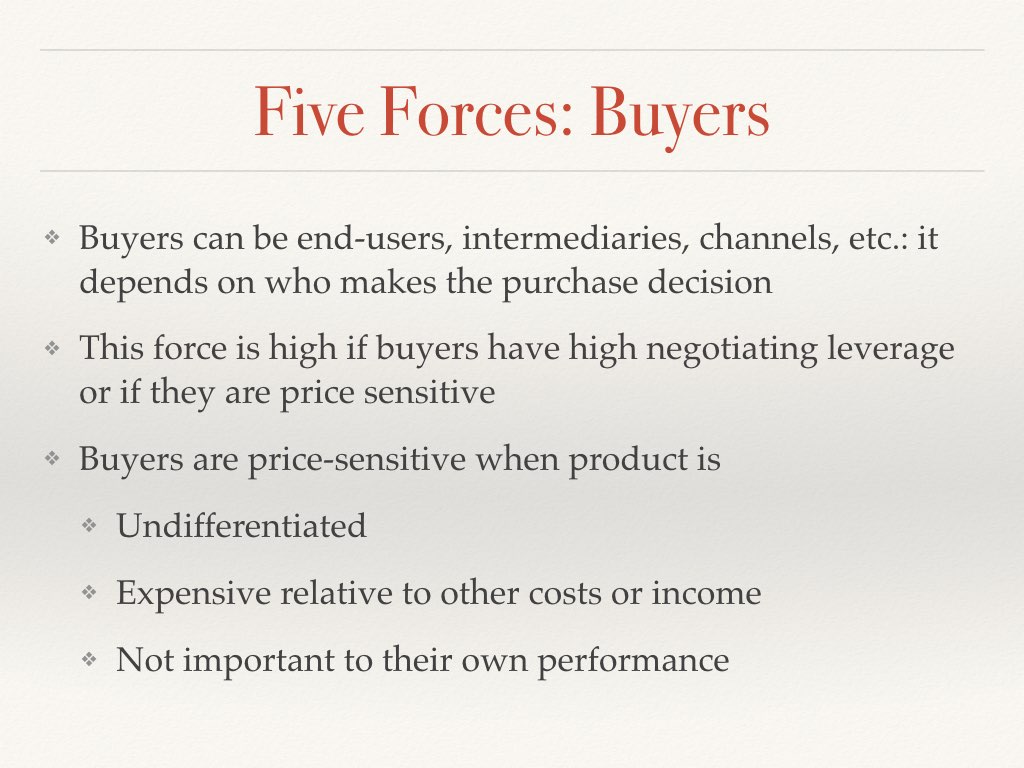


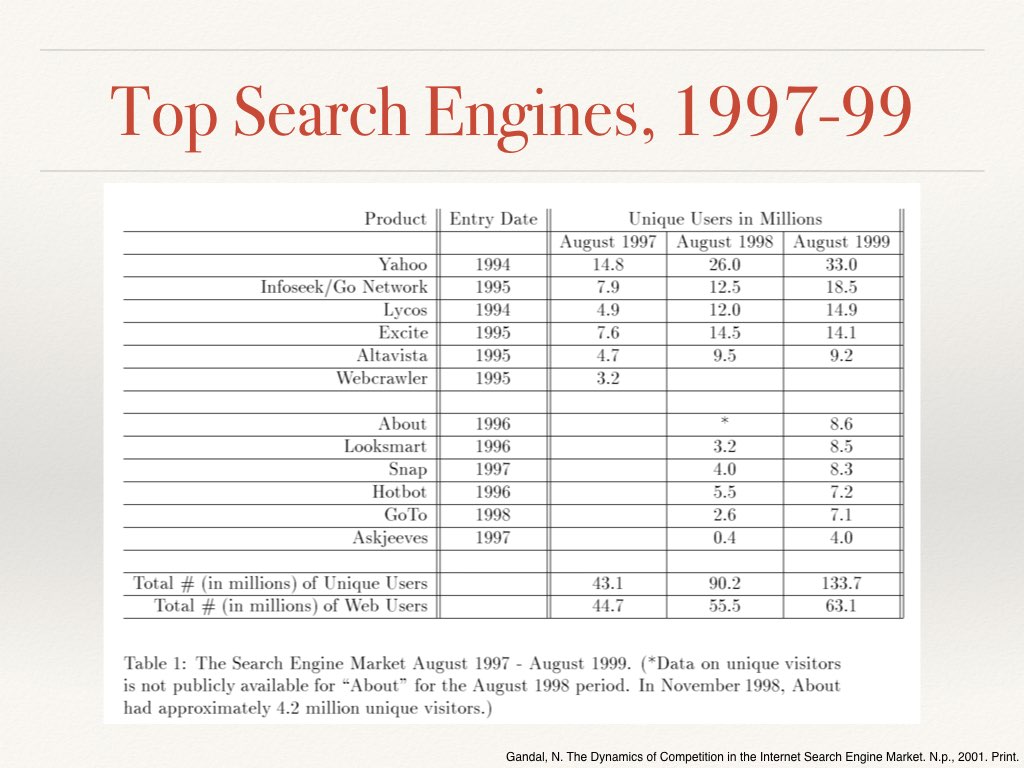
We had an argument in class over whether the power of buyers was low or high here. Since this is an analysis of users as buyers (not advertisers…that analysis should also be done) I argued it was low because, even though the portals were relatively undifferentiated, users did not pay anything, giving them low negotiating leverage. But the users can easily switch providers, arguing their power is high. The clincher for me is from the data below that shows that users used more than one portal on average. This argues that the threat of switching was not very credible. This is what allowed the portals to treat their users rather badly, in one sense, by trying to keep them from leaving the site at all.


This is the data showing that by 1998 the number of unique visitors to the top search engines/portals was greater than the number of web users in total. The obvious explanation was that each web user used a couple/several search engines.
Feel free to use these slides, with attribution, if they are useful.